Managers
Share

Key Takeaways
- Selected American Shares (SAS) returned +17.73% in 2024. The fund has consistently grown wealth for shareholders since Davis Advisors began management in 1993.
- A decade of speculation and momentum fueled by high government spending, artificially low interest rates and speculative capital—the free-money era—is coming to an end.
- The current period of economic transition towards normalization, coupled with technological change and geopolitical uncertainty, creates an environment of unexpected volatility and disruption.
- Our portfolio is made up of companies with resilient growth, durable earnings power, significant free cash flow and some combination of long-lived assets, pricing power, competitive advantage, balance sheet strength, proven management and attractive valuation.
- We focus on businesses with long-term growth and low valuations instead of the high valuations and unprecedented concentration of the equity indices. This positions us to reward long-term shareholders who have resisted chasing the fads and fashions of the last decade.
The average annual total returns for Selected American Shares Class S for periods ending December 31, 2024 are: 1 year, 17.73%; 5 years, 10.28%; and 10 years, 10.07%. The performance presented represents past performance and is not a guarantee of future results. Total return assumes reinvestment of dividends and capital gain distributions. Investment return and principal value will vary so that, when redeemed, an investor’s shares may be worth more or less than their original cost. For most recent month-end performance, click here or call 800-243-1575. Current performance may be lower or higher than the performance quoted. The total annual operating expense ratio for Class S shares as of the most recent prospectus was 0.99%. The total annual operating expense ratio may vary in future years. Returns and expenses for other classes of shares will vary.
This material includes candid statements and observations regarding investment strategies, individual securities, and economic and market conditions; however, there is no guarantee that these statements, opinions or forecasts will prove to be correct. All fund performance discussed within this material refers to Class S shares and are as of 12/31/24, unless otherwise noted. This is not a recommendation to buy, sell or hold any specific security.Past performance is not a guarantee of future results. The Attractive Growth and Undervalued reference in this material relates to underlying characteristics of the portfolio holdings. There is no guarantee that the Fund performance will be positive as equity markets are volatile and an investor may lose money.
Performance:
Building Long-Term Wealth
Selected American Shares (SAS) returned +17.73% in the year ended December 31, 2024, and has grown wealth for shareholders in all periods since Davis Advisors began management in 1993. The longer a shareholder has been invested in the fund, the more their savings have grown (see Figure 1).
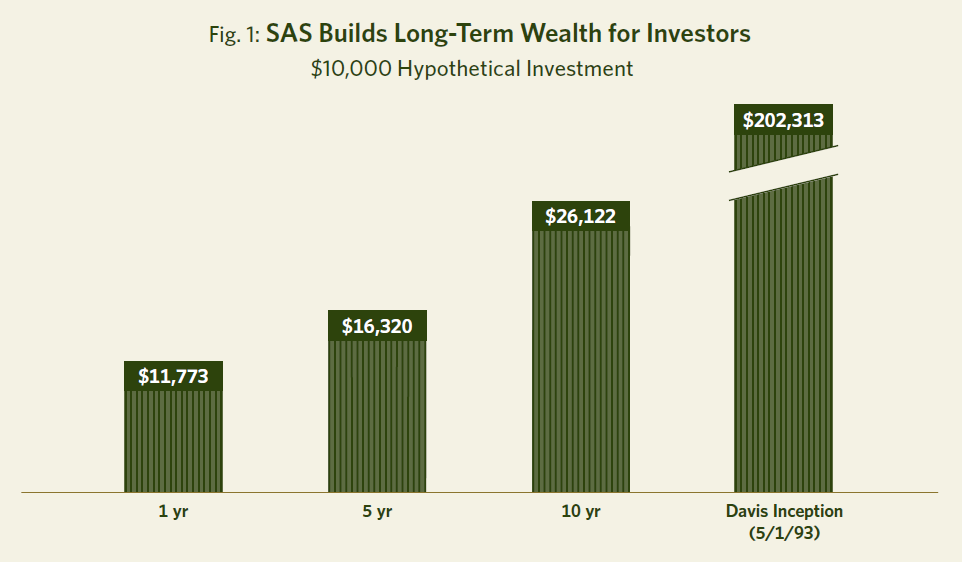
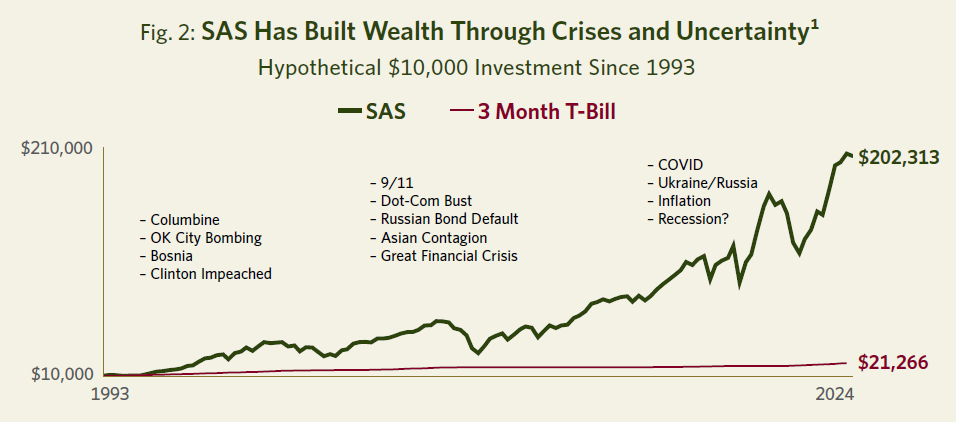
SAS one-year results added to the fund’s long-term record since Davis Advisors began management. Compounded over the fund’s life, this means an initial $10,000 investment in the fund when we took over management on May 1, 1993 would have grown to $202,313 by December 31, 2024 (see Figure 2). This is more than nine times higher than would have been achieved if the $10,000 had been held in money market funds for the same length of time.
Outlook:
Transition and Market Complacency equals Growing Risks and Select Opportunities
The economic, technological and geopolitical transitions under way paired with a complacent and concentrated market may lead to greater overall risk and a smaller opportunity set in the years ahead. In this changing environment, our investment discipline is laser-focused on identifying those select, durable and undervalued businesses prepared for transition. As this fast-changing environment unfolds, our fundamental analysis and selectivity are starting to be rewarded while the aggressive risk-taking that rewarded speculators in recent years is becoming more perilous. We are well-positioned for this transition and, after a decade in which our discipline was not rewarded, believe our patience is beginning to pay off.
Economic Transition: The End of Free-Money Era
Beginning with the financial crisis and continuing through March 2022, many of the tenets of sound investing seemed to become irrelevant. In the U.S., interest rate suppression (both directly and indirectly through a bond purchase program known as quantitative easing) accompanied by dramatic increases in government spending and ballooning Federal deficits became a matter of national policy. This was first in response to the Great Financial Crisis of 2008-2009 (GFC) and then to the COVID-19 crisis in 2020-2021.
As the cost of money approached zero despite huge increases in money supply, these policies created significant market distortions. Assets were mispriced, risks ignored, inflation allowed to metastasize, and valuation discipline penalized. After more than a decade of these distortions, the shift to a more normal environment began in March 2022 when the U.S. Federal Reserve recognized the reality of inflation and announced the first of 11 consecutive increases in the Federal funds benchmark rate. This was the steepest rate of change in the Fed’s history.
Given the sheer magnitude of the distortions created in the free-money era, the great unwinding that began in 2022 still has a long way to go. Investors should be prepared for unexpected disruptions and heightened volatility. Although the trigger may be unknowable, the high valuations of many of today’s market darlings rest on extremely rosy assumptions which could change quickly should the market’s current optimism be undercut by the unpleasant appearance of one or more so-called black swans, inevitable but unpredictable shocks to the system. As for the short term, we expect that recent interest rate cuts may prove to have been optimistic and that by far the greatest risks investors face today remain from inflation and speculation.
Technological Transition: AI and Its Implications
Technological disruption is also creating significant changes in the investment landscape as investors grapple with the implications of generative artificial intelligence, or so-called GenAI. While we are naturally skeptical of hype, we must begin by stating unequivocally that GenAI is likely to be one of the most transformational technological developments in modern history, and one that is almost certain to create new risks and drive major advances across numerous industries.
As long-term market observers, we are also equally certain that this revolutionary technology will lead to hyperbole, irrational exuberance2 and unfulfilled promises. The stock market in particular is susceptible to wishful thinking and the fear of missing out (FOMO). FOMO leads investors to pile into companies making the most headline-grabbing claims about the future while turning their backs on those with proven businesses with demonstrated competitive advantages. In particular, we believe many companies are being viewed as, and rewarded as, early beneficiaries of AI demand with the expectation that their revenues and earnings will continue to grow rapidly in the future.
The market for AI products and services, however, is still in its early days and competition is fierce. We believe it is very risky to project who the long-term winners and losers will be based on their past one or two years of performance. For example, the substantial technological and societal transformations that the internet heralded in the 1990s culminated in the dot-com bubble and subsequent crash. As our friend Bill Nygren, portfolio manager at Oakmark Funds, recently reminded investors, “in 2000, amidst ‘dot-com’ hysteria, the largest cap Internet companies were Cisco, America Online and Yahoo!. AOL and Yahoo! ended up nearly worthless, and Cisco … has lost 80% relative to the S&P 500 Index. We think these results should give pause to anyone believing the AI winners have already been determined.”3
AI is also likely to prove disruptive to once stable industries in ways that are difficult to anticipate. As one observer recently noted, “when the iPhone was invented, flashlight makers were not worried.” Many companies that have long been considered reliable safe havens or growth darlings are vulnerable to disruption as technology changes business models and consumer behavior. This type of disruption is likely to penalize momentum investors and trend followers who, by definition, assume past trends will continue, as well as risk-averse value investors who may wrongly flock to former safe havens in the service and consumer sectors before realizing that they are as prone to AI disruption as manufacturers once were to globalization. Meanwhile, this disruptive environment may create real opportunities for research-driven investors like us who are willing to be highly selective.
Geopolitical Transition: Economic Nationalism and Global Uncertainty
Geopolitical disruption is the third transition shaping the investment environment as economic nationalism and protectionism replace free trade and globalization. The prospect of higher labor costs, trade wars and increasing global conflict makes characteristics like durability, resiliency and adaptability more important than ever. Our focus on selecting companies that embody these characteristics may well be a tailwind in the decade ahead as investors come to recognize increasing fragility in a period of economic, technological and geopolitical transition.
Complacency, Risk and Select Opportunities
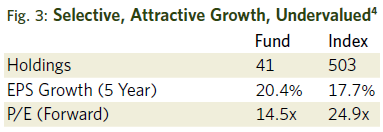
Typically, in an investment environment characterized by transition and uncertainty, markets trade at low valuations. Today, however, this uncertainty has been met with a complacency bordering on denial. Fortunately, in the face of an extremely richly valued and concentrated market, we have put together a very selective portfolio of companies that combine attractive growth with low valuations, a combination we call a value investor’s dream. As shown in Figure 3, our dramatic differentiation from the market allows us to be simultaneously wary of the S&P 500 Index, which is trading at multiples significantly above the historic average, and optimistic for our selective portfolio of companies which trades at almost a 42% discount to the S&P 500 Index while actually growing earnings slightly faster.
Before turning to the details of our portfolio, however, it is worth unpacking the complacency and risk we see in the high valuation and concentration of the indices at today’s levels. Several metrics give a good picture of the risks we see in the averages and the opportunity these risks create for our portfolio.
Record High Valuations
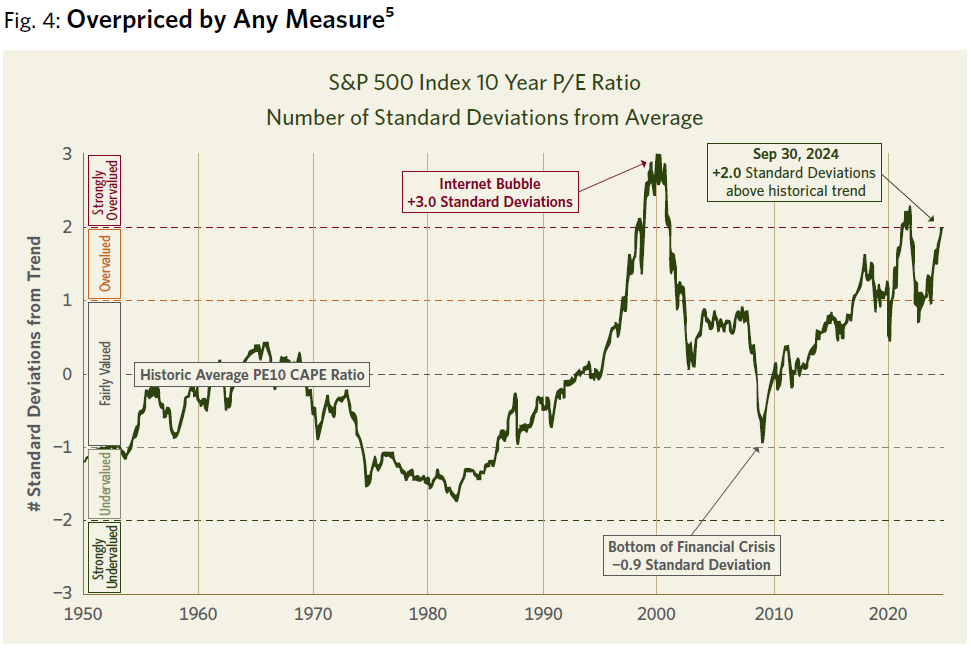
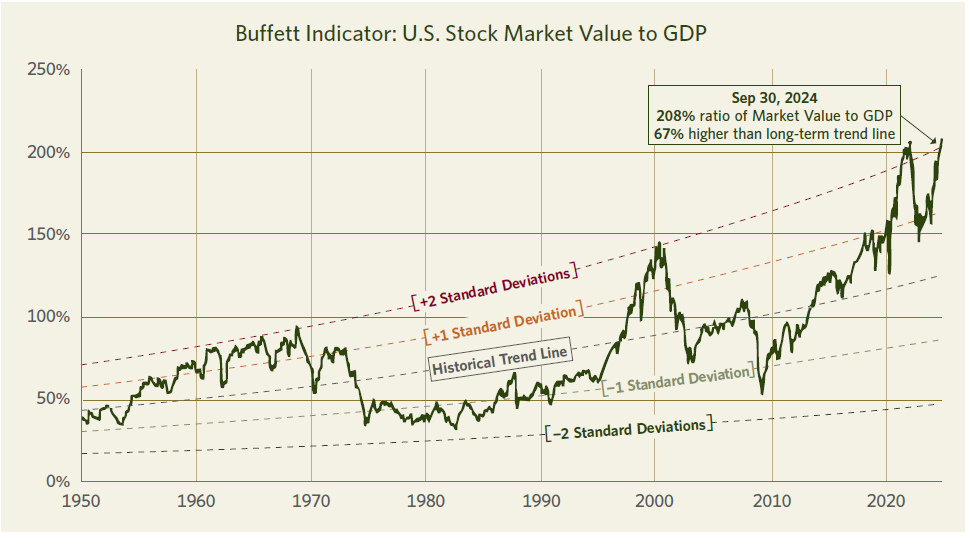
In terms of valuation, as can be seen in Figure 4, the P/E ratio of the S&P 500 Index is currently around two standard deviations above its historic average. At the same time, U.S. stock market value as a percentage of our total GDP (a ratio often referred to as the “Buffett Indicator” in honor of Warren Buffett who described it as one of the best long-term indicators of the relative attractiveness of stocks) is near its highest level in history.
Unprecedented Concentration
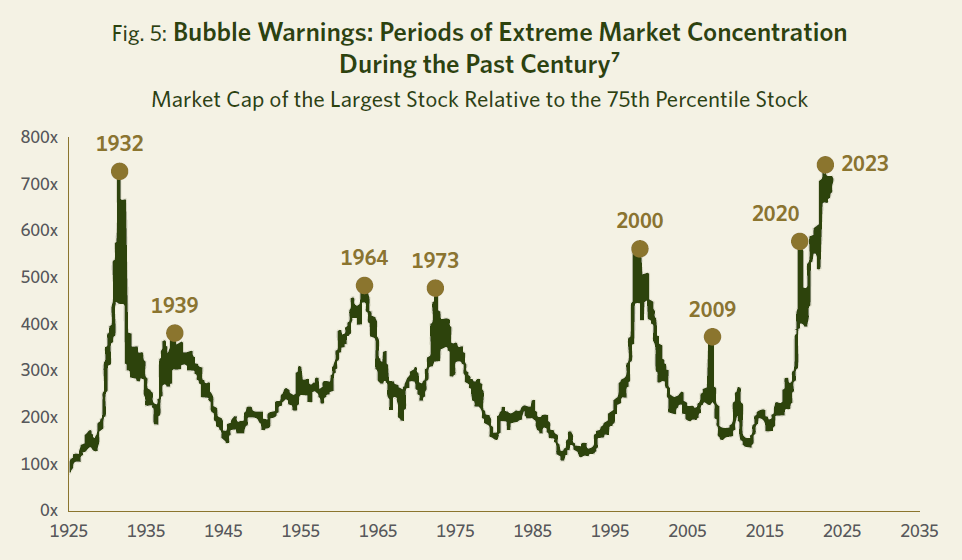
In terms of concentration, a handful of the largest companies represent an unprecedented concentration risk within the richly valued market averages. As shown in Figure 5, such concentration has tended to be a warning sign of a stock market bubble.
Select Opportunities
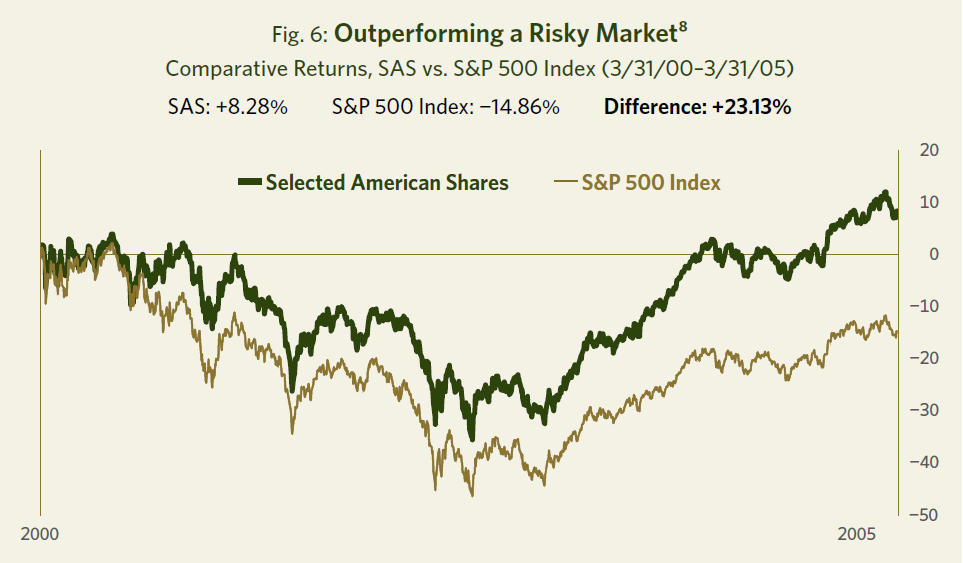
While such bubbles are bad news for index investors, they are often good news for stock pickers. For example, the beginning of the year 2000, much like today, shows up as an extremely overvalued and risky time to invest in the averages. Indeed, as can be seen in Figure 6, in the five years following the March 2000 peak, the total return of the S&P 500 Index was a negative 14.9%. However, a manager like us who had avoided the siren song of chasing momentum was rewarded for sticking to our discipline with a return of positive 8.3% and relative outperformance versus the S&P 500 Index of 23 percentage points over this five-year period.6
Portfolio Positioning:
Selective, Attractive Growth and Undervalued
Because we have steadfastly adhered to our long-term valuation discipline, the unwinding of the free-money bubble is an overdue but unsettling return to normalcy after more than a decade of delusion. As we return to reality and prepare for more volatile times, we are encouraged that the companies we own (including our carefully selected banks) are well-positioned for this changing environment as investors once again seek durability, profitability, cash production, reasonable valuation and balance sheet strength. These characteristics are becoming increasingly desirable because they allow companies to better navigate a period of transition and uncertainty. While this transition may create headwinds for many of the market darlings that led for so long, it may simultaneously create tailwinds for the type of durable, attractively valued businesses that lie at the heart of our investment discipline, rewarding the patience of our long-term clients.
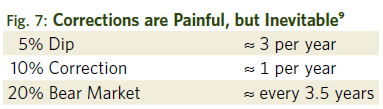
Our conviction includes the recognition that short-term corrections and surprises are an unpleasant but inevitable part of the investment landscape. History shows that investors should expect a 10% correction on average once per year and a 20% correction every 3.5 years (see Figure 7). Given the excesses of the last decade, we see no reason to imagine that the future will be immune from shocks, crises, volatility and corrections. Our job is not to predict the unpredictable but rather to prepare for the inevitable.
Portfolio Themes and Holdings
While we build our portfolios from the bottom up based on company-by-company research rather than top-down trends, most of the attractively valued and durable businesses we own reflect four overarching, long-term themes (see Figure 8).
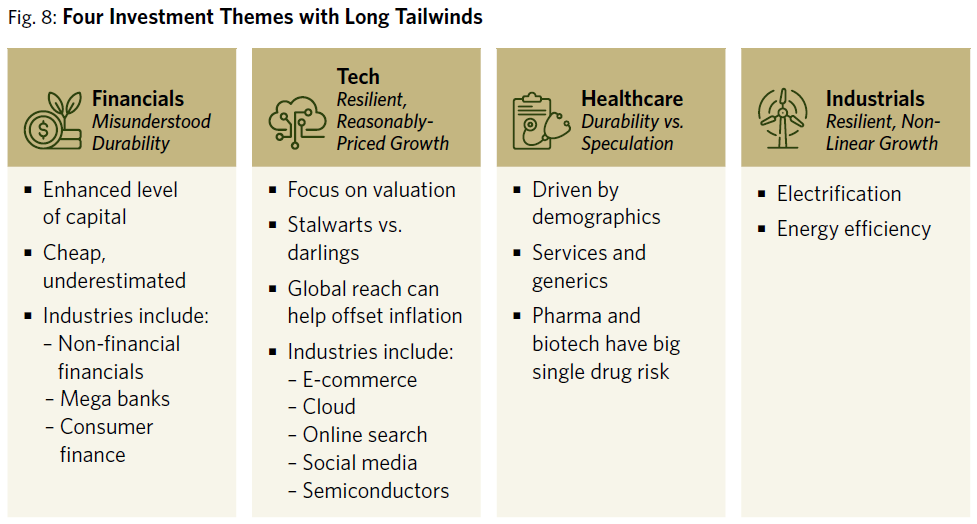
Financials: Misunderstood Durability
Financial companies represent SAS’s largest sector weighting and reflect a theme we describe as “Misunderstood Durability.” Since the Great Financial Crisis (GFC), investor sentiment has tended to view financial companies in general and banks in particular as fragile, volatile and prone to disaster. That two large banks (neither of which we ever owned), Silicon Valley Bank and First Republic, collapsed less than two years ago due to company-specific mismanagement reinforced a perception of fragility for all banks. This perception is understandable but inaccurate with regards to the select banks we own, such as Wells Fargo, Capital One and U.S. Bancorp. They actually grew their customer bases through both the GFC and the regional banking crisis of 2023. What’s more, throughout the last decade, a combination of higher capital ratios, larger market shares and tighter regulation have reduced the riskiness of these well-run institutions while increasing their durability and competitive advantages. Their quarterly and even annual earnings can be volatile. However, such “lumpiness” does not diminish the fact that these companies generate capital throughout the business cycle at an attractive rate and use the capital they generate to increase shareholder value by steadily increasing dividends and buying in shares at discounted prices.
Technology: Resilient, Reasonably-Priced Growth
Technology, broadly defined, makes up the portfolio’s next largest theme. As with financials, the term technology covers a broad range of companies with diverse types of business models. Within the tech universe, we focus on a select few companies that combine proven long-term growth with reasonable valuations. This valuation discipline has led us to avoid many of the market darlings that have driven the S&P 500 Index in recent years, including several of the so-called Magnificent Seven tech darlings that today represent a concentration of over 33% of the S&P 500 Index.10
In fact, while others have been piling into companies like Meta and Alphabet which we have owned for many years, we have used their outperformance in recent years as an opportunity to reduce our positions in these excellent, but richly valued, companies. Although we now own fewer shares, the strong business models and proven managements of these companies (along with Amazon) have still earned them a place in our portfolio. In addition, instead of market darlings such as Nvidia, Apple or Tesla, our remaining technology investments have been focused in durable, proven but less glamorous parts of the technology sector such as semiconductor manufacturing (Texas Instruments and Samsung) and capital equipment (Applied Materials).
As we discussed earlier, all investments (not just those in the technology sector) are likely to be affected by the much heralded breakthroughs in artificial intelligence. In preparing for this impact, investors should bear in mind Roy Amara’s famous law that we “overestimate the effect of a technology in the short run and underestimate the effect in the long run.”11 As with the internet, our approach is to avoid the “story stocks” and instead ask which companies can use this powerful new tool most effectively to build the value of their businesses and, just as importantly, which companies are most threatened by the new technology. While AI stocks will likely go through booms and busts, the underlying technology is transformative and seems certain to be a permanent part of the economic landscape going forward. As such, questions about its impact are already a standard part of our research process.
Healthcare: Durability vs. Speculation
For decades, healthcare spending relentlessly rose from 5% of U.S. GDP in 1960 to roughly 17% in 2010. However, reflecting the wisdom of Herb Stein’s famous observation that “if something cannot go on forever, it will stop,” the rollout of the Affordable Care Act in 2010, along with a range of other public and private initiatives, has led to a flattening of this growth since then. Today, while healthcare spending remains a political hot button, it is somewhat encouraging that 15 years later, its percentage of GDP still stands at 17% despite the invention of many expensive new therapies in the interim. To offset the rising costs of novel treatments and innovative (and patented) pharmaceutical therapies, the healthcare system has needed to constantly find savings elsewhere. As a result, our investments in this important sector have focused on those companies that play a part in moderating or reducing the natural rate of increase in healthcare spending. Companies such as Cigna and Humana, for example, offer programs like Medicare Advantage which deliver patients a higher quality of care at a lower cost. Given the inefficiencies and incentives of government agencies versus the private sector, we are not surprised that such companies have long records of success. Similarly, lab-testing companies like Quest Diagnostics and branded generics companies like Viatris continue to reduce costs in the healthcare system. On the other side of the ledger, while we marvel at the enormous profits created by novel pharmaceutical and biotech breakthroughs, we find it difficult and risky to try to predict the next winners while also quantifying the duration of those profits given the development of me-too competitors and evolving drug reimbursement policies.
Industrials: Resilient, Non-Linear Growth
In an age of digitization, software, AI, content creation, advertising and hot consumer brands, companies that operate railroads and generate electricity (Berkshire Hathaway), extract copper (Teck Resources), manufacture insulation (Owens Corning), supply food (Tyson) or produce oil (Tourmaline Oil) may sound dull, but our civilization cannot function without their products. The necessity of these products and, in many cases, the environmental risks of producing them, create regulatory and legal complexity. Their production often requires large upfront capital investment. In any short-term period, their demand and supply may be subject to cyclical swings, resulting in earnings volatility for producers. Further, as such products are not especially differentiated, price and availability are often the only drivers of customer preference, making it difficult for any one company to maintain high returns without attracting new competition.
So how do we find attractive opportunities in such a difficult category? First, because many such dull businesses are overlooked and out of favor in today’s growth-driven market, carefully selected industrials currently sell at extremely low valuations. This is despite their having long-term records of growth, durable earnings power, and competitive advantages driven by low-cost assets or economies of scale, and some inflation protection due to long-lived assets. What’s more, certain long-term trends may be accelerating the growth rates of a number of these companies. For example, in a world of massively expanding computing power, the need for electricity is markedly accelerating. Also, trends like electrification of automobiles and expansion of the electricity grid increase copper demand at a rate that is likely to continue to outstrip growth in supply (a byproduct of the enormous regulatory challenges of permitting and building new mines).
Finally, in ways that are hard to anticipate, the advent of AI discussed earlier is almost certain to create enormous disruptions in many white-collar service industries in much the same way that automation and globalization impacted U.S. manufacturing industries and blue collar workers in the 1980s and 1990s. As the services sector faces significant uncertainty in the years ahead, people may be more enthusiastic about our industrial holdings with their low valuations, dull business models and resistance to obsolescence.
Looking Ahead:
A Turning Tide
After a long stretch in which our investment discipline was out of favor, we see many indications that the tide is turning. The current combination of economic, technological and geopolitical transitions bodes poorly for momentum/trend-following investors, while high market valuations and extreme concentration bode poorly for the major stock indices and passive investors. In contrast, our highly selective approach and proven long-term investment discipline is becoming more important than ever.
While we expect periods of volatility and disruption as we move out of the era of free-money and cheap capital, the combination of above-average growth and below-average valuations that characterizes our portfolio today is rare. It positions us well to reward investors who resisted the bandwagon’s siren song and held fast to our patient, long-term approach to building generational wealth. The key pillars of success in this tumultuous environment are the cornerstones of our investment discipline, based on what we look for in our portfolio companies: cash generation, conservative capital structure, durable business model, low valuation and proven management.
For more than 50 years we have navigated a constantly changing investment landscape guided by one North Star: to grow the value of the funds entrusted to us. We are pleased to have achieved strong results thus far and look forward to the decades ahead. With more than $2 billion of our own money invested in our portfolios, we stand shoulder to shoulder with our clients on this long journey.12 We are grateful for your trust and are well-positioned for the future.
Source: Davis Advisors and Morningstar. Graph represents performance from 5/1/93 to 12/31/24. 3 Month T-Bill data is as of 9/30/24.Past performance is not a guarantee of future results.
Phrase coined by then Federal Reserve Board chair Alan Greenspan in 1996 during the dot-com era, and interpreted as a warning that the stock market
might be overvalued.
Oakmark Fund, “U.S. equity market commentary 2Q 2024,” 6/30/24.
Five-year EPS Growth Rate (5-year EPS) is the average annualized earnings per share growth for a company over the past 5 years. The values shown
are the weighted average of the 5-year EPS of the stocks in the Fund or Index. Approximately 5.31% of the assets of the Fund are not accounted for in the calculation of 5-year EPS as relevant information on certain companies is not available to the Fund’s data provider. Forward Price/Earnings (Forward P/E) Ratio is a stock’s price at the date indicated divided by the company’s forecasted earnings for the following 12 months based on estimates provided by the Fund’s data provider. These values for both the Fund and the Index are the weighted average of the stocks in the portfolio or Index.
Source: www.currentmarketvaluation.com.The “P/E Ratio” chart uses the cyclically adjusted P/E (CAPE) ratio which takes the average earnings over the last 10 years compared to the current stock market price. The CAPE ratio avoids the problem of a major recession year when earnings decline rapidly, such as by 90% in 2008, when, despite a dramatic decline in the stock market, the P/E ratio using current earnings jumped up to 120x.) The Buffett Indicator is named in honor of Warren Buffett who described it as one of the best long-term indicators of the relative attractiveness of stocks.
Past performance is not a guarantee of future results.
Source: Compustat, CRSP, Kenneth R. French, Goldman Sachs Global Investment Research.
Source: Bloomberg.
Source: Ned Davis Research.
Seven companies commonly recognized for their market dominance, technological impact, and changes to consumer behavior and economic trends:
Alphabet, Amazon, Apple, Meta, Microsoft, Nvidia, and Tesla.
Roy Amara (1925–2007) was an American scientist and president of the Institute for the Future.
As of 12/31/24, Davis Advisors, the Davis family and Foundation, our employees, and Fund directors have more than $2 billion invested alongside
clients in similarly managed accounts and strategies.
This material is authorized for use by existing shareholders. A current Selected American Shares prospectus must accompany or precede this material if it is distributed to prospective shareholders. You should carefully consider the Fund’s investment objective, risks, fees, and expenses before investing. Read the prospectus carefully before you invest or send money.
This material includes candid statements and observations regarding investment strategies, individual securities, and economic and market conditions; however, there is no guarantee that these statements, opinions or forecasts will prove to be correct. These comments may also include the expression of opinions that are speculative in nature and should not be relied on as statements of fact.
Davis Advisors is committed to communicating with our investment partners as candidly as possible because we believe our investors benefit from understanding our investment philosophy and approach. Our views and opinions include “forward-looking statements” which may or may not be accurate over the long term. Forward-looking statements can be identified by words like “believe,” “expect,” “anticipate,” or similar expressions. You should not place undue reliance on forward-looking statements, which are current as of the date of this material. We disclaim any obligation to update or alter any forward-looking statements, whether as a result of new information, future events, or otherwise. While we believe we have a reasonable basis for our appraisals and we have confidence in our opinions, actual results may differ materially from those we anticipate.
Objective and Risks. The investment objective of Selected American Shares is capital growth and income. In the current market environment, we expect that income will be low. There can be no assurance that the Fund will achieve its objective. Some important risks of an investment in the Fund are: stock market risk: stock markets have periods of rising prices and periods of falling prices, including sharp declines; common stock risk: an adverse event may have a negative impact on a company and could result in a decline in the price of its common stock; financial services risk: investing a significant portion of assets in the financial services sector may cause the Fund to be more sensitive to problems affecting financial companies; foreign country risk: foreign companies may be subject to greater risk as foreign economies may not be as strong or diversified. As of 3/31/25, the Fund had approximately 19.2% of net assets invested in foreign companies; headline risk: the Fund may invest in a company when the company becomes the center of controversy. The company’s stock may never recover or may become worthless; large-capitalization companies risk: companies with $10 billion or more in market capitalization generally experience slower rates of growth in earnings per share than do mid- and small-capitalization companies; manager risk: poor security selection may cause the Fund to underperform relevant benchmarks; depositary receipts risk: depositary receipts involve higher expenses and may trade at a discount (or premium) to the underlying security and may be less liquid than the underlying securities listed on an exchange; emerging market risk: securities of issuers in emerging and developing markets may present risks not found in more mature markets; fees and expenses risk: the Fund may not earn enough through income and capital appreciation to offset the operating expenses of the Fund; foreign currency risk: the change in value of a foreign currency against the U.S. dollar will result in a change in the U.S. dollar value of securities denominated in that foreign currency; and mid- and small-capitalization companies risk: companies with less than $10 billion in market capitalization typically have more limited product lines, markets and financial resources than larger companies, and may trade less frequently and in more limited volume. See the prospectus for a complete description of the principal risks.
The information provided in this material should not be considered a recommendation to buy, sell or hold any particular security. As of 12/31/24,
the top ten holdings of Selected American Shares were: Meta Platforms, 9.07%; Capital One Financial, 8.46%; Berkshire Hathaway, 8.09%; Applied
Materials, 4.82%; Viatris, 4.60%; Amazon.com, 4.51%; Alphabet, 4.31%; MGM Resorts, 3.76%; Texas Instruments, 3.27%; and Humana, 3.25%.
Selected Funds has adopted a Portfolio Holdings Disclosure policy that governs the release of non-public portfolio holding information. This policy is described in the Statement of Additional Information. Holding percentages are subject to change. Click here or call 800-243-1575 for the most current public portfolio holdings information.
Davis Selected Advisers, L.P., began managing Selected American Shares on 5/1/93. Prior to that date, the Fund was managed by a different investment advisor.
The Global Industry Classification Standard (GICS®) is the exclusive intellectual property of MSCI Inc. (MSCI) and S&P Global (“S&P”). Neither MSCI, S&P, their affiliates, nor any of their third party providers (“GICS Parties”) makes any representations or warranties, express or implied, with respect to GICS or the results to be obtained by the use thereof, and expressly disclaim all warranties, including warranties of accuracy, completeness, merchantability and fitness for a particular purpose. The GICS Parties shall not have any liability for any direct, indirect, special, punitive, consequential or any other damages (including lost profits) even if notified of such damages.
Standard Deviation is a measure of the average deviations of a return series from its mean; often used as a risk measure. A large standard deviation implies that there have been large swings or volatility in the manager’s return series.
We gather our index data from a combination of reputable sources, including, but not limited to, Lipper, Wilshire and index websites.
The S&P 500 Index is an unmanaged index of 500 selected common stocks, most of which are listed on the New York Stock Exchange. The index is adjusted for dividends, weighted towards stocks with large market capitalizations and represents approximately two-thirds of the total market value of all domestic common stocks. Investments cannot be made directly in an index.
After 4/30/25, this material must be accompanied by a supplement containing performance data for the most recent quarter end.
Item #4770 12/24 Davis Distributors, LLC, 2949 East Elvira Road, Suite 101, Tucson, AZ 85756, 800-243-1575, selectedfunds.com
Selected American Shares
Annual Review 2025
Managers