Manager
Share

Key Takeaways
- Selected International Fund (SIF) posted a strong return of +16.70% in the first six months of 2025, though this was below the performance of the MSCI ACWI (All Country World Index) ex US benchmark.
- A diverse group of companies in financials, communication services, information technology and consumer discretionary drove strong results.
- Chinese companies remain attractively valued and are increasingly at the forefront of cutting-edge industries.
- While high market valuations remain a key investment risk, our portfolio has been built to emphasize durability and resilience. We focus on competitively advantaged companies with strong managements trading at attractive valuations that can be expected to produce good results through shifting economic conditions.
The average annual total returns for Selected International Fund Class S share for periods ending June 30, 2025, are: 1 year, 31.08%; 5 years, 5.38%; and 10 years, 4.32%. The performance presented represents past performance and is not a guarantee of future results. Total return assumes reinvestment of dividends and capital gain distributions. Investment return and principal value will vary so that, when redeemed, an investor’s shares may be worth more or less than their original cost. For most recent month-end performance, visit selectedfunds.com or call 800-243-1575. Current performance may be lower or higher than the performance quoted. The gross annual operating expense ratio for Class S shares as of the most recent prospectus was 1.70%. The Adviser is contractually committed to waive fees and/or reimburse the Fund’s expenses to the extent necessary to cap total annual fund operating expenses of Class S shares at 1.05%. For purposes of this expense cap, operating expenses do not include foreign tax reclaim filing expenses. The expense cap expires May 1, 2026. The total annual operating expense ratio may vary in future years. Returns and expenses for other classes of shares will vary.
This material includes candid statements and observations regarding investment strategies, individual securities, and economic and market conditions; however, there is no guarantee that these statements, opinions or forecasts will prove to be correct. All fund performance discussed within this material refers to Class S shares and are as of 6/30/25, unless otherwise noted. This is not a recommendation to buy, sell or hold any specific security. Past performance is not a guarantee of future results. The Attractive Growth and Undervalued reference in this material relates to underlying characteristics of the portfolio holdings. There is no guarantee that the Fund performance will be positive as equity markets are volatile and an investor may lose money.
Performance
Selected International Fund (SIF) posted a strong return of +16.70% in the six months ended June 30, 2025, slightly below the +17.90% return of the MSCI ACWI ex US. In this report, we discuss factors that contributed to the fund’s good performance, along with any underperformers during the same period.
Contributors to Performance
Contributors to SIF’s performance were diverse and from several sectors, including financials, communication services, information technology and consumer discretionary.
In financials, results were driven by Danske Bank (Denmark), which returned 53% in the first half of 2025, Metro Bank (U.K.) which returned 54% and AIA Group (Hong Kong) which returned 26%.
Danske Bank posted good results in the first half of 2025 (1H25) with continued modest growth, strong cost discipline and low charge-offs. The bank is overcapitalized—it has an 18.7% Tier 1 capital ratio compared to a requirement of 14.6% and a company target of 16%—so we are expecting strong shareholder returns. We anticipate a 10–12% shareholder return annually for several years through a 7–8% dividend yield combined with the repurchase of 3% of the shares. The Danish krone’s 12% appreciation relative to the U.S. dollar in 1H25 also benefited our portfolio. Danske Bank’s valuation remains attractive, in our view, at 8x 2026 owner earnings.
Metro Bank returned to profitability in 1Q25 after several years of struggling with stubborn costs and capital shortfalls. Metro should have rapidly improving returns going forward as it has sold off low-yielding mortgage loan assets and is deploying capital into higher margin specialist lending. The bank has also structurally reduced its cost base by cutting a quarter of its work force. Metro remains attractive at 7x 2026 owner earnings.
AIA Group saw a 13% growth in new business in 1Q25 that was broad-based across its pan-Asian footprint. Margins also continue to improve driven by a mix shift to more protection-focused policies. Capital return has been consistent with AIA as it reduced outstanding share count by 5% last year while paying a dividend of 2.3%. We expect 9–11% earnings per share (EPS) growth annually over the medium term. Valuation remains attractive at under 12x 2026 owner earnings or 1.3x trailing embedded value.
In communication services, Chinese technology company NetEase gained 54% and Southeast Asia’s dominant e-commerce platform, Sea Limited, was up 51% in the first half of 2025. NetEase’s recently launched games have performed well, and strong cost discipline led owner earnings to grow by 38% year-over-year in 1Q25. Meanwhile Shopee, owned by Sea Limited, saw revenues rise 28% and earnings flip sharply positive in the first quarter of 2025 compared to last year when Shopee was still in investment mode.
The information technology sector was a solid contributor in the first half of the year, driven by a 24% return from Samsung Electronics and a 26% return from Japanese semiconductor equipment company, Tokyo Electron.
Samsung revenues rose 10% year-over-year in 1Q25 as demand for memory chips remained strong and its handset business sold 61 million units during the quarter (compared to Apple’s 50 million) with good pricing. Uncertainty remains around tariff levels and export controls but Samsung, the world’s largest memory and handset manufacturer and second-largest semiconductor foundry, trading at only 9x owner earnings, remains attractive.
Tokyo Electron’s revenues were up 20% in 1Q25 driven by strong DRAM revenue growth of 51% and signs of a recovery in the NAND market. Tokyo Electron’s competitive position remains strong as does its balance sheet with a net cash position.
In consumer discretionary, both South African multinational Naspers and its operating entity, Prosus, returned 40% in the first half. Its main holding, Chinese multimedia company Tencent, saw revenues rise 13% and owner earnings up 15% year-over-year in 1Q25. Tencent’s video game business and its WeChat video accounts (short form videos like TikTok) saw good growth, enabling it to continue investing in AI by hiring talent and investing in data centers.
Online U.K. gaming company Entain Plc was another positive contributor in consumer discretionary, with its shares up 46% in the first half. Revenues in its international gaming operations were up 9% year-over-year in 1Q25. The standout performance came from BetMGM, its 50/50 joint venture with MGM Resorts International, where revenues rose 34% in 1Q25, led by strong results in its sports betting business. Company guidance is now for BetMGM to progress from a loss of $244 million in 2024 to earning at least $150 million in 2025.
Detractors from Performance
Meituan, the leading food delivery company in China, was down 18% in the first half of 2025 as competition from JD.com and Alibaba is expected to hurt profitability in 2025. Competition in the instant shopping space (fast delivery in under one hour) has spilled into food delivery. However, since Meituan’s competitors are relying on unprofitable consumer subsidies to take share, we expect the intensity of competition to eventually subside, as it did in other industries facing similar situations such as ridesharing, in-store marketing, online travel and e-commerce.
The leading Chinese online travel agency Trip.com Group was down 14% in the first half of 2025 as margins disappointed, mainly due to its increased investment in its international Trip.com app. Revenues grew a healthy 16% year-over-year in 1Q25, but operating profits only grew 7% instead of slightly improving, as is usual. However, we support management’s decision to sacrifice short-term profit margins to grow air ticketing and hotel room volumes (which rose 60% in 1Q25) to invest in the long-term health of the Trip.com platform.
Market Perspectives:
Be Selective, Stay the Course
The first half of 2025 was a very volatile period for equity markets. The S&P 500 Index hit all-time highs in January as investors were optimistic that the new Trump administration’s deregulation agenda would drive higher economic growth and corporate profits. In late January, however, the release of the Chinese DeepSeek AI model, R1, caused a big drop in technology stocks. DeepSeek showed an ability to create a leading-edge AI model with lower memory and computational resources. This led to concerns that investors had overestimated the number of semiconductors and data centers that would be needed for the broad AI rollout. Then in early April, the Trump administration unveiled much higher and more comprehensive tariffs than expected, leading to fears of renewed inflation, delayed interest rate cuts and weaker consumer spending. This caused the S&P 500 Index to fall a further 12% over four trading days.
On April 9, however, a 90-day pause in the highest tariffs was announced, shocking the S&P 500 Index into a 9.5% leap in a single day. As the market became more convinced that the highest tariff levels would not be implemented, including a 145% tariff on Chinese goods (which was also rolled back), the focus turned to the stimulative effects of the large tax cut passed by Congress. The net result was that over the first six months of 2025 the S&P 500 Index returned a positive 6.2%.
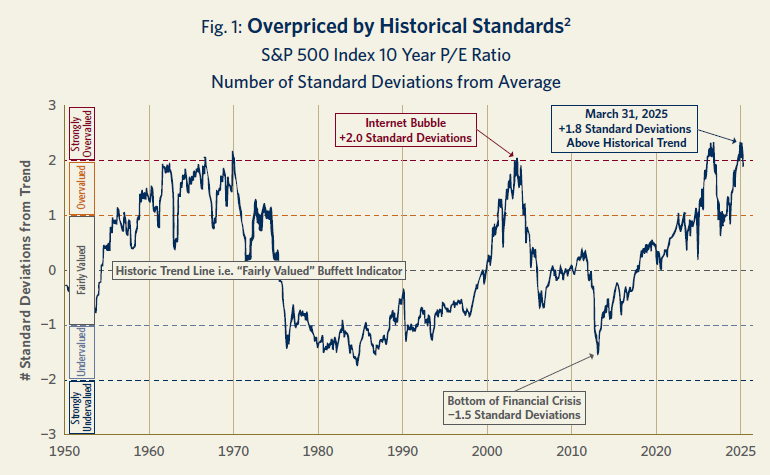
High stock market valuations continue to be a major risk facing investors today. A substantial part of these lofty expectations is tied to the technology sector broadly defined (information technology plus communications services). Combined, this was at an all-time high share of 42.9% of the S&P 500 Index’s market capitalization at the end of June 2025, higher even than the previous peak in February 2000.1
As seen in Figure 1, the price/earnings (P/E) ratio of the S&P 500 Index was almost two standard deviations above its historic average at the end of March 2025.
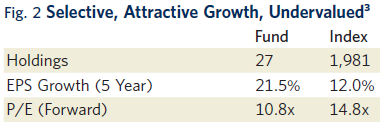
Although equity markets are trading at high valuations, SIF portfolio companies’ average earnings growth exceeds that of its MSCI ACWI ex US benchmark while the portfolio also has an average P/E valuation well below the benchmark (see Figure 2). By selectively investing in competitively advantaged companies run by experienced and talented managers, and purchasing these companies at attractive valuations, Davis Advisors has consistently grown wealth for its investors since its founding over five decades ago. We believe this selective portfolio of high-quality companies trading at low valuations bodes well for future returns.
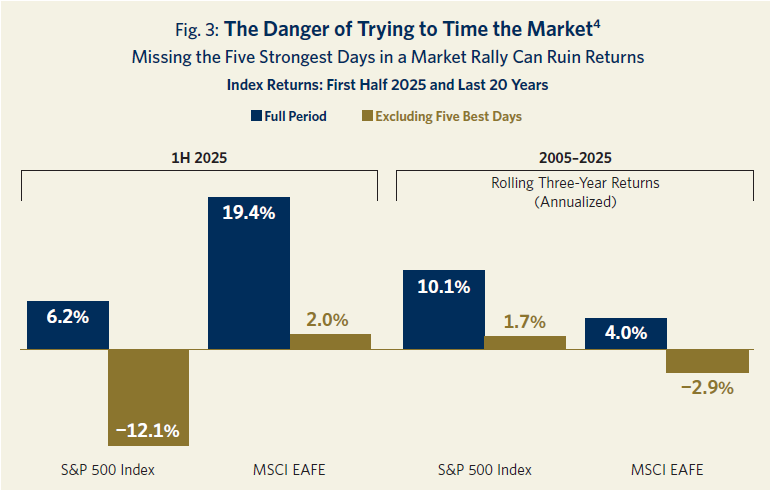
In addition to selecting companies with durable competitive advantages at attractive valuations, an important tenet of successful investing is to remain invested and stay the course. The cost of trying to time the market is large and real. Figure 3 shows the difference in results between staying invested and missing the five best market days over the first half of 2025 and for all three-year rolling periods from 2005 to 2025. For example, an investor in the S&P 500 Index who missed the five best days in the first half of 2025 would have underperformed a buy-and-hold investor by more than 18 percentage points. Trying to time the market can carry a high price.
State of the Economy
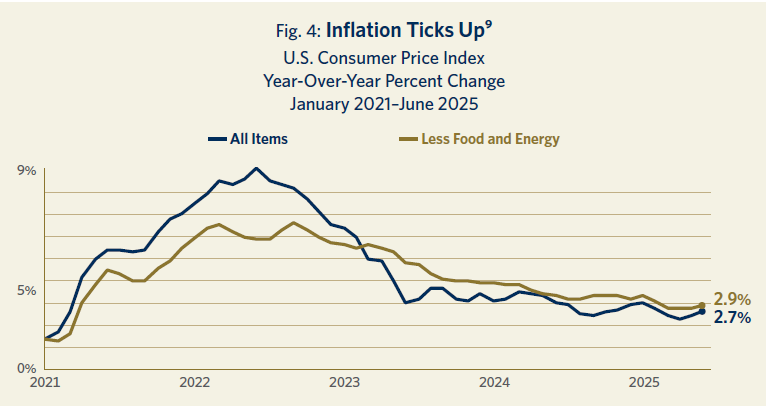
Despite inflationary expectations jumping up to 5.0% in April, the actual year-to-date inflation as measured by the consumer price index (CPI) has largely remained in check (see Figure 4). However, in June, the CPI ticked up to 2.7%, higher than the previous three months and raised the concern that inventories purchased before the tariffs were exhausted, and that we were starting to see the higher price of tariffed goods show up in the data.
In 1Q25 U.S. GDP growth was anemic, falling at an annual rate of -0.5%. This was mainly due to a surge of imports ahead of the tariffs being implemented and a downturn in government spending. (Imports are a subtraction in the calculation of GDP.)5
Second-quarter GDP is forecast to rebound to 2.8% growth.6 The high level of pre-buying of imports in the first quarter is expected to lead to a drop in imports in the second quarter, and consumer spending is anticipated to stay resilient.
The forecast for U.S. economic growth in the second half of the year, however, is weak. The tariffs implemented in the second quarter are expected to lead to higher consumer prices in the third quarter and especially in the fourth quarter. The Conference Board is projecting GDP growth of 1.4% in the third quarter and only 0.8% in the fourth quarter, with full-year 2025 GDP growth expected to be 1.6%.7 The uncertainty factor in all economic forecasts for 2025 is high as we have not seen tariffs at current levels since 1910.
Nonetheless, there is good reason to expect some impact on consumer spending given that the current average effective tariff rate of 15.8% (as of July 17, 2025) is forecast to result in a $2,000 decline in average U.S. household spending power, according to The Budget Lab at Yale.8 Even if the U.S. administration does not implement the higher tariffs that it has proposed if no trade deals are reached, the current average tariff level will likely lead to lower economic growth and corporate profitability.
The fall in global GDP expectations as well as reduced trade with the world’s largest economy (the U.S.) has impacted most emerging markets, including China, India, Brazil, Mexico and Southeast Asia. Developed economies such as Canada and France also expect to see lower growth rates in 2025 compared to 2024. The current forecast for global GDP growth in 2025 is 2.9%, down from 3.1% in January.
Euro area growth expectations are for 2025 GDP growth similar to last year, at 0.9%, based on reduced trade with the U.S. offset by an increase in deficit spending in some countries such as Germany.10 As a result of these lower long-term growth expectations, SIF’s European holdings are generally corporations with a global focus that have customers and investments in a number of geographies. One example is the investment company Prosus, headquartered in Amsterdam but with large investments in China, India and the U.S. Others include the Swiss financial Julius Baer, a global wealth manager, and the German food delivery firm Delivery Hero, which has a major presence in South Korea and the Middle East. We also own Danske Bank, which is the largest bank in Denmark, a country that is an outlier in Europe with an expected robust GDP growth rate of 2.9% in 2025.11
China:
Too Important to Ignore
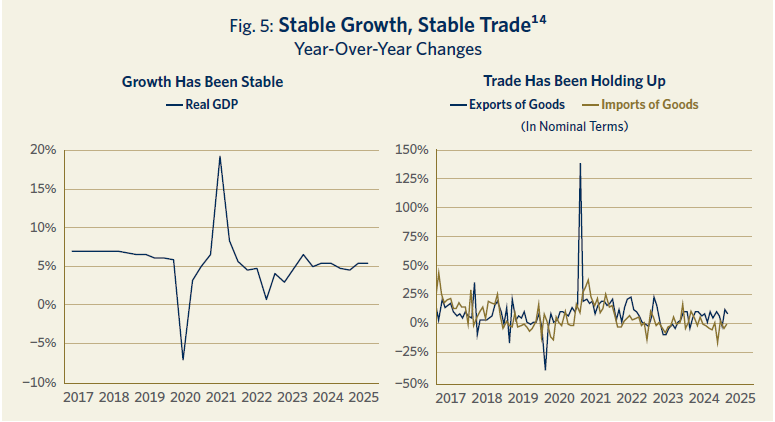
Long-term investors need to pay attention to China due to the size of its economy, its strong rate of growth and its high level of innovation. With a 2025 GDP forecast at over $19 trillion and having grown 5.3% in the first half of the year, the world’s second largest economy is too big and growing too fast to ignore. Some 52% of first-half growth in China came from consumer spending and 31% from exports as consumption is increasingly becoming the key driver of growth.12 Expectations are for a trade-related slowdown in the second half, but with full-year 2025 GDP expected to grow at a still respectable 4.7% rate (see Figure 5).13
Sometimes investors question the reliability of Chinese GDP data, and the U.S. Federal Reserve took up this question in a study published on June 6, 2025. The paper, titled “Is China Really Growing at 5 Percent?,” has a lot of good data and is worth reading.15 The authors compare official Chinese GDP figures with a “large set of indicators that are informative about the Chinese business cycle, including industrial production, retail sales, property market data, and reported exports to China from other countries, among others.”
The key conclusion is that “our findings suggest that recent GDP growth figures, which have been in line with the stated target, appear to align closely with broader Chinese economic indicators and do not appear to be overstated. We find that the recent near-target growth has been driven by a strong supply-side performance, supported by sustained global demand for Chinese goods and industrial policies promoting self-reliance. This has helped offset weak domestic consumption, which never fully recovered from COVID-era lockdowns and continues to be constrained by the ongoing property slump.” We will remain vigilant, however, about the data we rely on to make investment decisions which includes comparing government published economic figures to key industrial and third-party data.
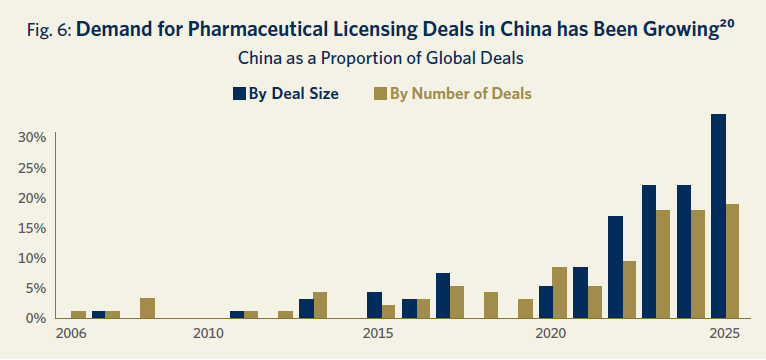
In our nearly two decades of investing in China, we have seen its level of innovation surge, positioning it at the forefront of several cutting-edge industries. China accounts for over 70% of global electric vehicle (EV) production,16 80% of global battery cell production17 and over 80% of global solar panel production.18 China is also growing in high-tech sectors where traditionally it did not have a major presence. In the first half of 2025, China’s share of global biotech and pharmaceutical licensing deals was 18% by number of deals and over 30% by deal size (see Figure 6). These figures are up from about 5% prior to 2020 so the ability to create novel therapies is a recent development.19
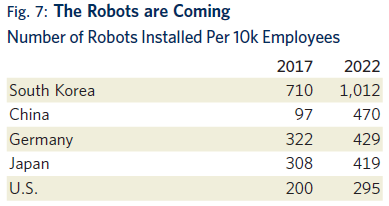
Robotics is another industry where China recently lagged but is now close to leading. The main driver has been the growth of the industrial robot sector—this is despite headline-grabbing stories like the recent deployment of 41 robots in Shenzhen that ride the subway to restock the over 100 7-Eleven convenience stores located in the subway system.21
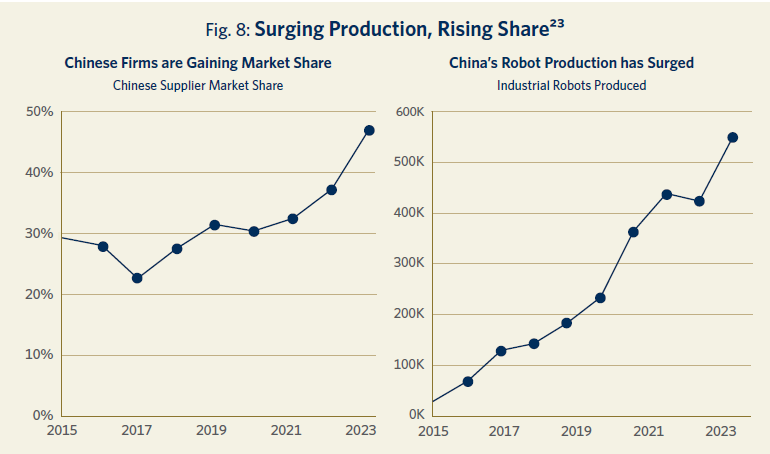
A decade ago, annual production of industrial robots in China was 33,000. By 2024 it had reached 560,000, an increase of nearly 17 times. The automation of China’s large domestic manufacturing base was key in driving the growth of Chinese industrial robots. In five short years China went from a laggard in automation to a leader, ahead of Germany, Japan and the U.S. (see Figure 7).
The quality of China’s industrial robots has also improved, and domestically produced robots are now taking a growing share of the home market, which used to be dominated by foreign brands (see Figure 8).
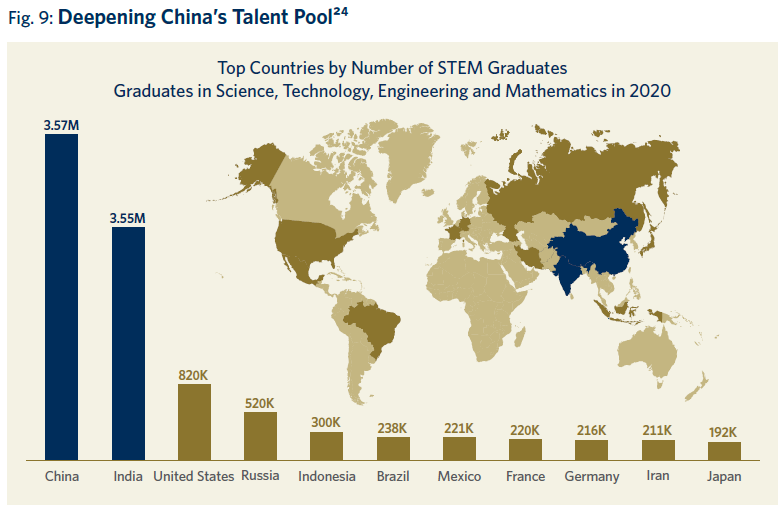
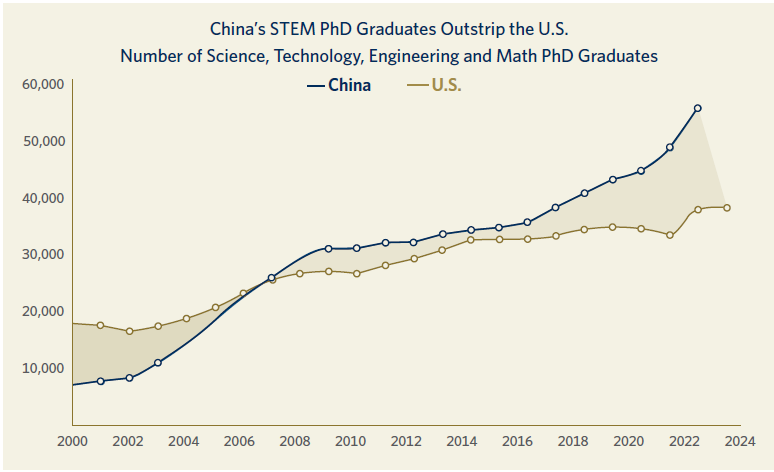
One of the main reasons for China’s success in innovation-driven industries is its huge and growing science, technology, engineering and mathematics (STEM) talent pool. China leads the world in the number of STEM graduates produced annually (see Figure 9). This lead in STEM talent compounds over time as STEM graduates launch the next generation of innovation-driven companies and create more opportunities for future STEM graduates. The quality of STEM graduates in China has also increased—now China produces the most STEM PhDs in the world, and its lead has been growing.22
While size, pace of growth and a high rate of innovation are strong motivations to study Chinese investments, the reason to own them today are their attractive valuations (see Figure 10).
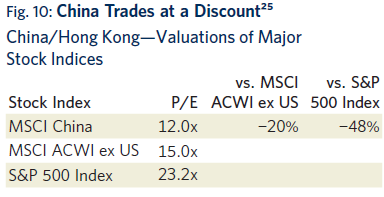
The MSCI China Index was trading at a very significant 20% discount to MSCI ACWI ex US as of July 18, 2025, and an even greater 48% discount to the S&P 500 Index, making several of these high-quality innovative companies attractive long-term investments. Investing in China contains risks including geopolitics, trade relations and a possible economic downturn. However, we feel that the attractive valuations for China’s world-class companies are currently compelling for long-term investors.
Portfolio Holdings
NetEase
Founded in 1997, NetEase is the second largest online video game developer and publisher in China. Like many Chinese internet companies, NetEase is a founder-led company with William Ding (only 53 years old) at its helm. The company owns and operates a large portfolio of mobile and PC games popular among Chinese gamers. NetEase’s roots are in the massively multiplayer online role-playing game (MMORPG) genre. It has several flagship titles like Westward Journey and Fantasy Westward Journey that date back to the early 2000s yet remain meaningful revenue generators even today. NetEase was originally a PC-based game developer but has successfully transitioned its titles to mobile and, over time, has expanded its game portfolio via in-house development and through partnerships with Western IP holders like Marvel and Blizzard. The online video game business is the key value driver, making up 79% of revenues and an even higher percentage of profits. However, the company has also organically stood up a handful of other businesses over the years with its ventures in online education (Youdao) and streaming music (Cloud Music) being the most notable.
NetEase’s games are primarily free-to-play with monetization coming from the sale of in-game virtual items such as special avatars, privileges and weapons. Mobile games generated 73% of NetEase’s gaming revenues in 2024 with the remainder coming from PC games. Owning and operating category-leading free-to-play online games has proven to be a great business over time, particularly as key franchises continue to prove their durability and stickiness with users. New hit games are increasingly difficult and risky to develop given the rising cost per game and falling success rate. NetEase has a highly profitable portfolio of franchise games and a strong track record of producing hit games. This makes it one of the few game developers well-positioned to earn good returns on future game development and capitalize on the long-term growth potential of the market.
In late 2024, when the market was concerned about near-term revenue weakness in several game franchises, we took advantage of weakness to build a position in NetEase at an attractive valuation. Even after its strong year-to-date performance in 2025, NetEase remains reasonably priced at just 14x expected 2026 owner earnings, given its improved growth outlook and best-in-class management team with a long track record of shareholder returns. Key risks include the potential for further regulations that put restrictions on new game licenses, playing time or monetization, a prolonged period in which the company fails to develop new hit games, and increased competition from rival Tencent.
ITOCHU
Founded in 1858 by Ito Chubei, ITOCHU is a leading Japanese sogo sosha (trading and investment company). ITOCHU is like Berkshire Hathaway (which is one of its largest shareholders) without the insurance businesses. It even shares a similar beginning in the textiles business. The trading business focuses on a wide array of products from raw materials to finished products across industries like textiles, chemicals, energy and food. ITOCHU’s investment business takes strategic positions in companies and assets across the value chain. Its approach is hands on and long term, with a focus on integrating investments across the ITOCHU platforms. Currently, ITOCHU has more than 200 consolidated businesses.
ITOCHU is attractive due to its disciplined investment process and capital allocation. It makes no large directional bets and focuses on steady returns in boring businesses. ITOCHU attracts top talent in Japan and offers employees an opportunity to work in a variety of industries and geographies. The company has built its deep expertise trading for and owning businesses in all aspects of the local economy for decades and counts on this deep operating knowledge to make capital allocation decisions.
ITOCHU trades at under 12x P/E and 1.9x trailing price-to-book. We believe ITOCHU can generate a mid-teens return on equity over the medium term which should enable it to grow earnings by high single digits while paying a 2–3% cash yield and doing modest share buybacks.
The key risks with ITOCHU would be a change in investment culture and substantial capital allocation to businesses outside of its core competence.
Outlook:
Durability and Resilience
In a year of extreme volatility and uncertainty, we are pleased that our focus on owning companies with durable competitive advantages run by experienced managers trading at attractive valuations has enabled us to outperform our market index over the past year. The significant valuation discount that our portfolio trades at compared to our benchmark indicates that we did not sacrifice our valuation discipline to achieve strong results. Rather the combination of strong earnings growth and a low valuation led to strong investment gains.
We remain watchful for risks which include the high valuation of certain stocks, inflationary pressures, trade relations, large government deficits and debt levels, geopolitical volatility and recession threats. However, our portfolio has been built with a focus on durability and resilience. We expect our portfolio companies’ strong balance sheets, cash generation power and adaptability to produce good results through shifting economic conditions.
For more than 50 years we have navigated a constantly changing investment landscape guided by one North Star: to grow the value of the funds entrusted to us. We are pleased to have achieved strong results thus far and look forward to the decades ahead. With more than $2 billion of our own money invested in our portfolios, we stand shoulder to shoulder with our clients on this long journey.26 We are grateful for your trust and are well-positioned for the future.
MacroMicro.me, “US—S&P 500—Weightings by GICS Sector (Monthly)”—June 2025 https://en.macromicro.me/charts/121244/sp-500-gics-sectors-weightings-monthly.
Source: www.currentmarketvaluation.com. The “S&P 500 Index 10 Year P/E Ratio” chart uses the cyclically adjusted P/E (CAPE) ratio which takes the average earnings over the last 10 years compared to the current stock market price. The CAPE ratio avoids the problem of a major recession year when earnings decline rapidly, such as by 90% in 2008, when, despite a dramatic decline in the stock market, the P/E ratio using current earnings jumped up to 120x.
Source: Davis Advisors. 5-Year Annual EPS Growth is the weighted average of the average annualized earnings per share growth of the stocks in the Fund or Index over the past five years. Approximately 16.77% of the assets of the Fund are not accounted for in the calculation of 5-Year Annual EPS Growth as relevant information on certain companies is not available to the Fund’s data provider. Forward P/E is the weighted average of the forward price/earnings ratios for the stocks in the Fund or Index, calculated as each stock’s price at the date indicated divided by the company’s forecast earnings for the following 12 months based on estimates provided by the Fund’s data provider.
Source: FactSet, MSCI, S&P, AllianceBernstein. Annualized trailing three-year daily returns of the S&P 500 Index and MSCI EAFE Index and trailing three-year daily returns where the five best days are excluded from each rolling three-year period and are calculated every business day from January 2008 (trailing three years goes back to January 2005) through end of June 2025. The average of these returns in then calculated.
U.S. Bureau of Economic Analysis, “Gross Domestic Product, 1st Quarter 2025 (Third Estimate),” 6/26/25 https://www.bea.gov/news/2025/gross-domestic-product-1st-quarter-2025-third-estimate-gdp-industry-and-corporate-profits.
The Conference Board, “The Conference Board Economic Forecast for the US Economy,” 7/11/25 https://www.conference-board.org/research/us-forecast.
Ibid.
The Budget Lab (Yale University), “State of U.S. Tariffs,” 6/17/25 https://budgetlab.yale.edu/research/state-us-tariffs-june-17-2025.
Source: U.S. Bureau of Labor Statistics. Data as of 7/15/25. Not seasonally adjusted.
The Conference Board, “Global Uncertainty Persists,” 7/11/25 https://www.conference-board.org/publications/global-economic-forecast-update#::text=Global%20Uncertainty%20Persists,global%20outlook%20earlier%20this%20year.
International Monetary Fund, “Denmark at a Glance” https://www.imf.org/en/Countries/DNK.
myNews, “China’s strong GDP figures stoke debate over stimulus as US tariff risks loom,” 7/15/25 https://www.scmp.com/economy/china-economy/article/3318214/chinas-economy-grows-52-second-quarter-us-trade-truce-offers-boost.
The Conference Board, “Global Economic Outlook,” 7/11/25 https://www.conference-board.org/topics/global-economic-outlook.
Source: CEIC from OECD Economic Outlook, Volume 2025 Issue 1. https://www.oecd.org/en/publications/2025/06/oecd-economic-outlook-volume-2025-issue-1_1fd979a8/full-report/china_bb7827bc.html.
U.S. Federal Reserve, FEDS Notes, “Is China Really Growing at 5 Percent?,” 6/6/25 https://www.federalreserve.gov/econres/notes/feds-notes/is-china-really-growing-at-5-percent-20250606.html.
IEA, “Global EV Outlook 2025, Trends in the electric car industry” https://www.iea.org/reports/global-ev-outlook-2025/trends-in-the-electric-car-industry-3.
IEA, “Global EV Outlook 2025, Electric vehicle batteries” https://www.iea.org/reports/global-ev-outlook-2025/electric-vehicle-batteries#abstract.
IEA, “Solar PV Global Supply Chains” https://www.iea.org/reports/solar-pv-global-supply-chains/executive-summary.
Financial Times, “Big Pharma is increasingly reliant on Chinese biotech advances,” [paywall] https://www.ft.com/content/89285fd5-cd24-4772-a53d-0553cd37032d.
Source: Jefferies, PharmCube.
myNews, “In China, delivery robots now ride the subway to restock 7-Eleven stores,” 7/15/25. https://www.scmp.com/economy/china-economy/article/3318287/china-delivery-robots-now-ride-subway-restock-7-eleven-stores.
FDI Intelligence, “China’s universities outpace US peers amid tech competition,” 4/30/25 https://www.fdiintelligence.com/content/d0a58f39-0ed0-4b58-8c51-477133b6d9e1.
Source: IFR, Moody’s Ratings, WIND, National Bureau of Statistics of China https://www.moodys.com/web/en/us/insights/data-stories/robotics-global-2025.html.
Source: FDI Intelligence https://www.fdiintelligence.com/content/d0a58f39-0ed0-4b58-8c51-477133b6d9e1.
Source: Bloomberg. Data as of 7/18/25.
As of 6/30/25, Davis Advisors, the Davis family and Foundation, our employees, and Fund directors have more than $2 billion invested alongside clients in similarly managed accounts and strategies.
This material is authorized for use by existing shareholders. A current Selected International Fund prospectus must accompany or precede this piece if it is distributed to prospective shareholders. You should carefully consider the Fund’s investment objective, risks, fees, and expenses before investing. Read the prospectus carefully before you invest or send money.
This material includes candid statements and observations regarding investment strategies, individual securities, and economic and market conditions; however, there is no guarantee that these statements, opinions or forecasts will prove to be correct. These comments may also include the expression of opinions that are speculative in nature and should not be relied on as statements of fact.
Davis Advisors is committed to communicating with our investment partners as candidly as possible because we believe our investors benefit from understanding our investment philosophy and approach. Our views and opinions include “forward-looking statements” which may or may not be accurate over the long term. Forward-looking statements can be identified by words like “believe,” “expect,” “anticipate,” or similar expressions. You should not place undue reliance on forward-looking statements, which are current as of the date of this report. We disclaim any obligation to update or alter any forward-looking statements, whether as a result of new information, future events, or otherwise. While we believe we have a reasonable basis for our appraisals and we have confidence in our opinions, actual results may differ materially from those we anticipate.
Objective and Risks. The investment objective of Selected International Fund is capital growth. There can be no assurance that the Fund will achieve its objective. Some important risks of an investment in the Fund are: stock market risk: stock markets have periods of rising prices and periods of falling prices, including sharp declines; common stock risk: an adverse event may have a negative impact on a company and could result in a decline in the price of its common stock; foreign country risk: foreign companies may be subject to greater risk as foreign economies may not be as strong or diversified; China risk – generally: investment in Chinese securities may subject the Fund to risks that are specific to China including, but not limited to, general development, level of government involvement, wealth distribution, and structure; headline risk: the Fund may invest in a company when the company becomes the center of controversy. The company’s stock may never recover or may become worthless; depositary receipts risk: depositary receipts involve higher expenses and may trade at a discount (or premium) to the underlying security and may be less liquid than the underlying securities listed on an exchange; foreign currency risk: the change in value of a foreign currency against the U.S. dollar will result in a change in the U.S. dollar value of securities denominated in that foreign currency; exposure to industry or sector risk: significant exposure to a particular industry or sector may cause the Fund to be more impacted by risks relating to and developments affecting the industry or sector; emerging market risk: securities of issuers in emerging and developing markets may present risks not found in more mature markets. As of 9/30/25, the Fund had approximately 46.2% of net assets invested in emerging markets; large-capitalization companies risk: companies with $10 billion or more in market capitalization generally experience slower rates of growth in earnings per share than do mid- and small-capitalization companies; manager risk: poor security selection may cause the Fund to underperform relevant benchmarks; fees and expenses risk: the Fund may not earn enough through income and capital appreciation to offset the operating expenses of the Fund; mid- and small-capitalization companies risk: companies with less than $10 billion in market capitalization typically have more limited product lines, markets and financial resources than larger companies, and may trade less frequently and in more limited volume; and shareholder concentration risk: from time to time, a relatively large percentage (over 20%) of the Fund’s shares may be held by related shareholders. A large redemption by one or more of such shareholders may reduce the Fund’s. liquidity, may increase the Fund’s transactions and transaction costs, may result in substantial capital gains distributions for shareholders, and may increase the Fund’s ongoing operating expenses, which could negatively impact the remaining shareholders of the Fund. See the prospectus for a complete description of the principal risks.
The information provided in this material should not be considered a recommendation to buy, sell or hold any particular security. As of 6/30/25, the top ten holdings of Selected International Fund were: Danske Bank, 10.31%; Naspers, 6.74%; Ping An Insurance Group, 5.99%; Prosus, 5.78%; Meituan, 5.16%; Entain, 5.00%; Julius Baer Group, 4.87%; AIA Group, 4.85%; Samsung Electronics, 4.81%; and DiDi Global, 4.70%.
Selected Funds has adopted a Portfolio Holdings Disclosure policy that governs the release of non-public portfolio holding information. This policy is described in the Statement of Additional Information. Holding percentages are subject to change. Click here or call 800-243-1575 for the most current public portfolio holdings information.
Davis Advisors began active daily management of Selected International Fund on 6/1/01. From 5/1/93 until 5/31/01, Davis Advisors had a subadvisor that handled the active daily management of the Fund.
Effective 5/1/11, Selected Special Shares was renamed Selected International Fund. The Fund’s investment strategy was modified to invest primarily in a diversified portfolio of common stocks issued by companies outside the U.S., including countries with developed or emerging markets. The Fund was otherwise unchanged.
The Global Industry Classification Standard (GICS®) is the exclusive intellectual property of MSCI Inc. (MSCI) and S&P Global (“S&P”). Neither MSCI, S&P, their affiliates, nor any of their third party providers (“GICS Parties”) makes any representations or warranties, express or implied, with respect to GICS or the results to be obtained by the use thereof, and expressly disclaim all warranties, including warranties of accuracy, completeness, merchantability and fitness for a particular purpose. The GICS Parties shall not have any liability for any direct, indirect, special, punitive, consequential or any other damages (including lost profits) even if notified of such damages.
The Consumer Price Index (CPI) measures the monthly change in prices paid by U.S. consumers. The U.S. Bureau of Labor Statistics (BLS) calculates the CPI as a weighted average of prices for a basket of goods and services representative of aggregate U.S. consumer spending.
We gather our index data from a combination of reputable sources, including, but not limited to, Lipper, Clearwater Wilshire Atlas and index websites.
The MSCI ACWI (All Country World Index) ex US is a free float-adjusted market capitalization weighted index that is designed to measure the equity market performance of developed and emerging markets, excluding the United States. The index includes reinvestment of dividends, net of foreign withholding taxes. Investments cannot be made directly in an index. The S&P 500 Index is an unmanaged index that covers 500 leading companies and captures approximately 80% coverage of available market capitalization. Investments cannot be made directly in an index. The MSCI China Index captures large- and mid-cap representation across China A shares, H shares, B shares, Red chips, P chips and foreign listings (e.g., ADRs). With 756 constituents, the index covers about 85% of this China equity universe. Currently, the index includes Large Cap A and Mid Cap A shares represented at 20% of their free float adjusted market capitalization. Investments cannot be made directly in an index.
After 10/31/25, this material must be accompanied by a supplement containing performance data for the most recent quarter end.
Item #4404 6/25 Davis Distributors, LLC, 2949 East Elvira Road, Suite 101, Tucson, AZ 85756, 800-243-1575, selectedfunds.com
Selected International Fund
Semi-Annual Review 2025
Managers